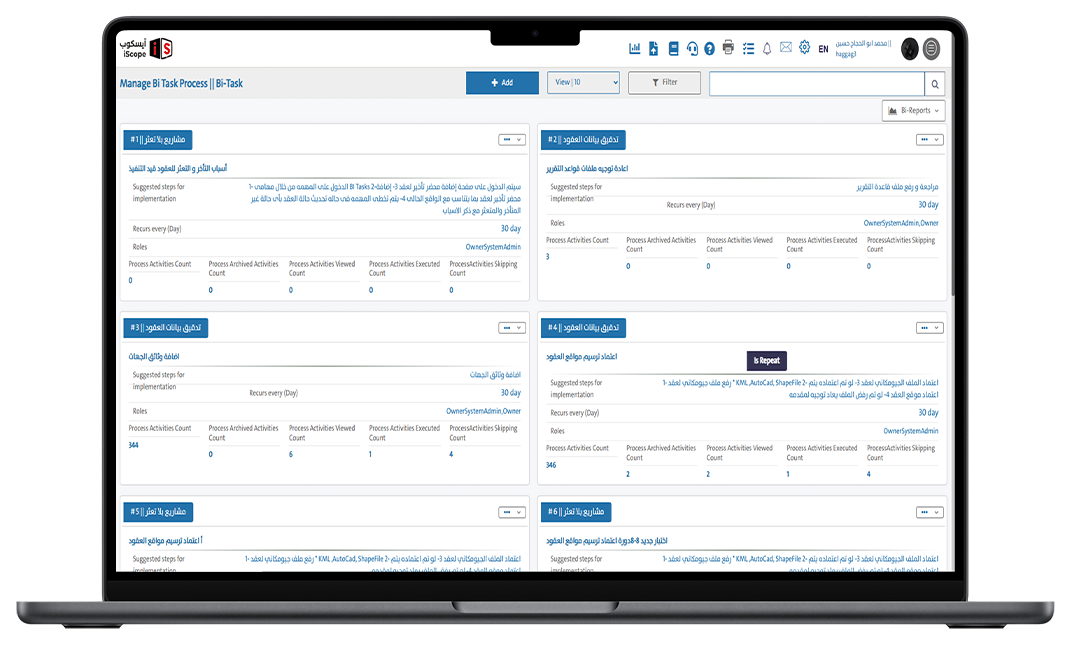
iScope Business Intelligence


Unified Data & Analytics Platform
Aggregate your data from multiple sources into one centralized environment, and analyze it using advanced BI tools without switching between systems. All reports, indicators, and integrations are available in one intuitive, streamlined interface.

Faster & Smarter Decisions Based on Real Data
Leverage real-time dashboards, precise KPIs, and interactive reports to support rapid and effective decision-making. The system enables forecasting issues, analyzing performance gaps, and optimizing operations through accurate, up-to-date data.

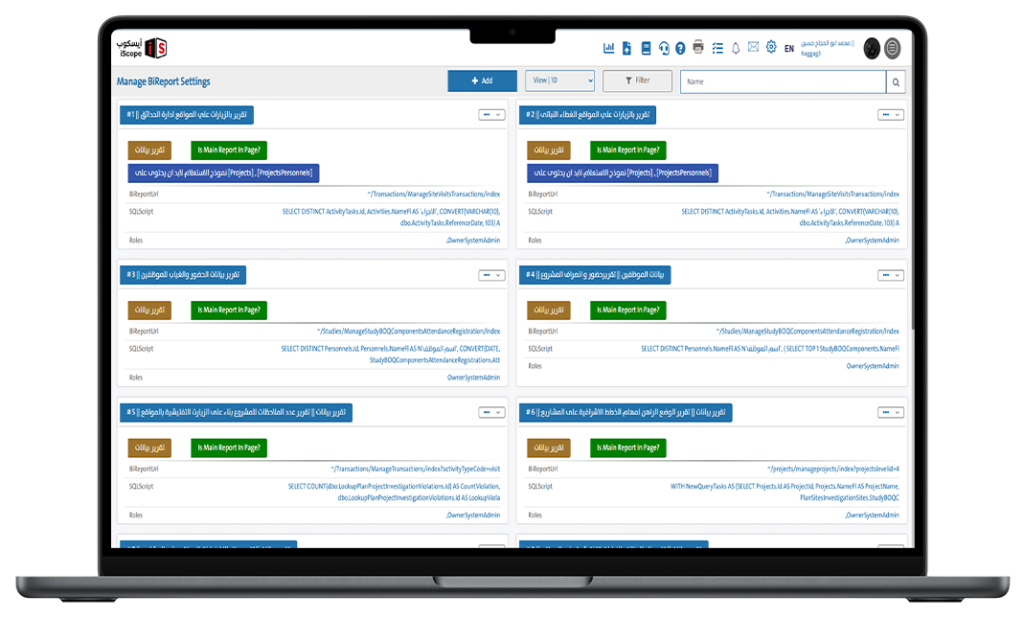
Customize Visualization Types & Components
Choose from multiple chart types (bar, line, heatmaps, KPIs, and more) to present data in a way that aligns with the analytical objective and end user

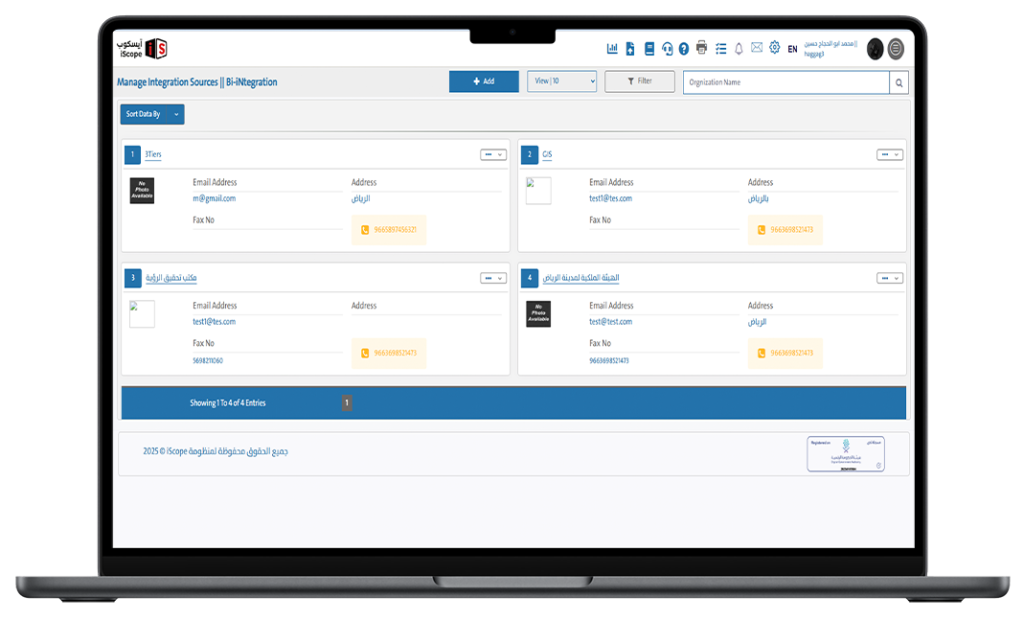
Link with Internal & External Data Sources
Connect visualizations to various data sources — internal project databases, accounting systems, or external integrations — to provide contextual, comprehensive analysis

Define Filters & Analytical Logic
Set up dynamic filtering rules to tailor views for specific users or departments, such as filtering by region or time period

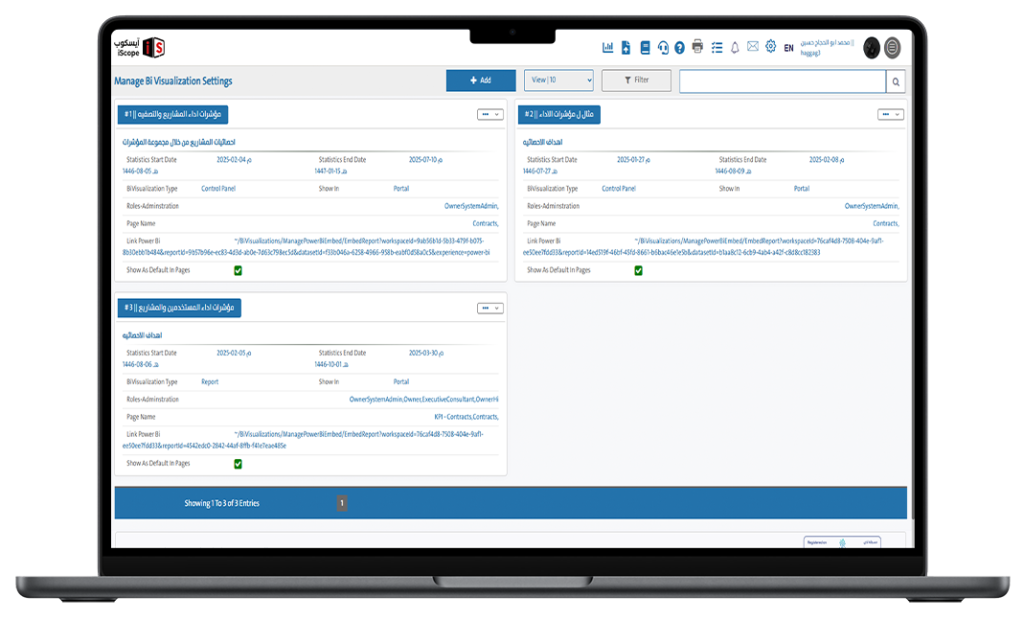
Control Where Visuals Appear in the System
Choose where these insights are displayed within the system (e.g., user dashboards, specific reports, or project pages), making information easier to access and act upon